


Photo taken by ChemLinked reporter Fang Lin on 7 May, 2014.
According to ICAMA statistics, China’s pesticide export volume dropped by 3.16 %( year on year) to some 428, 5000 tones in the first three month of 2014. In the same period the value of exports increased by 0.18% to 2.19 billion USD. Export volume of glyphosate grew by 8.81% to 133,282 tones but it’s valued decreased by 3% to 494.23 million USD, in contrast to the same period last year, when the prices were rising. The import volume increased by 12.21% to 21, 800 tones and the value decreased by 8.07% to some 204 million USD. The massive trade surplus does however make China’s pesticide industry more susceptible to the vagaries of global demand and market forces than many of its global counterparts. China exported more formulated products than technical materials and the contribution of these formulated products as a proportion of total exports grew even further. China is still a target of MNCs as about nine out of ten imported products are formulated products.
Export and Import in Q1 2014 | |||||||
Export/Import | Technical/ formulation | Volume (000 tons) | Change (%YoY) | Percentage of total volume (%) | Value ( million USD) | Change (%) | Percentage of total value (%YoY) |
Export | Technical | 153 | -13.59 | 35.72 | 1226 | -6.60 | 55.98 |
Formulated products | 275.5 | 2.95 | 64.28 | 964 | 10.37 | 44.02 | |
Import | Technical | 1.7 | -35.19 | 7.85 | 21 | -49.23 | 10.35 |
Formulated products | 20.1 | 19.66 | 92.15 | 183 | 1.42 | 89.65 | |
Exportation to Asia and Africa maintained double digital growth but the volume and value of Latin America regions shrunk by 3% and the performances of European and North American exports were dismal.
Volume and Value of the Pesticide Export to the Destination Regions in Q1 2014 | ||||
Region | Volume (000 tons) | Change(% YoY) | Value (million USD) | Change(% YoY) |
Asia | 162.8 | 14.15 | 775 | 28.16 |
Latin America | 77.6 | -3.73 | 409 | -3.41 |
Europe | 50.4 | -22.23 | 341 | -13.08 |
North America | 39 | -45.20 | 302 | -33.51 |
Africa | 79.7 | 17.23 | 249 | 19.90 |
Australasia | 19.1 | 1.91 | 114 | 9.73 |
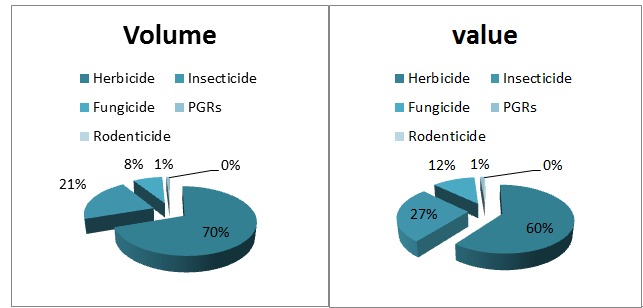
Herbicide remained the most exported product with 69% of total export volume directly attributed to this category, followed by insecticide, fungicide, PGRs and rodenticide.
Volume and Value of Different Product Category Exported in Q1 2014 | ||||||
| Volume (000 tons) | Change(% YoY) | Percentage of the Total Volume (%) | Value (million USD) | Change(% YoY) | Percentage of the Total Value (%) |
Herbicide | 298.782 | -62.5 | 69.72 | 1,324.65 | -3.76 | 60.50 |
Insecticide | 91.232 | 8.84 | 21.29 | 581.19 | 11.99 | 36.54 |
Fungicide | 34.689 | 0.38 | 8.09 | 255.87 | 5.29 | 11.69 |
PGRs | 3.713 | -50.14 | 0.87 | 26.95 | -41.68 | 1.23 |
Rodenticide | 0.147 | -34.96 | 0.03 | 0.93 | -10.58 | 0.04 |
Glyphosate was by far the most exported active ingredient. Some 133.282 tons or 494 million USD worth of the herbicide was exported in the first quarter. Though paraquat export volume dropped by 15.61% to 38,516 tons, it exhibited a 43.29% growth in value to some 148.65 million USD, displacing imidacloprid as the second most exported active ingredient.
Volume and Value of the Top 10 most Exported Active Ingredient in Q1 2014 | ||||||||
| Volume | Value | ||||||
No. | Active Ingredient | Volume (000 tons) | Change (%YoY) | Percentage of total volume (%) | Active Ingredient | Value (million USD) | Change (%YoY) | Percentage of total value (%) |
1 | glyphosate | 133.282 | 8.81 | 31.10 | glyphosate | 494.23 | -3.00 | 22.57 |
2 | paraquat | 38.516 | -15.61 | 8.99 | paraquat | 148.65 | 43.29 | 6.79 |
3 | glyphosate-isopropyl ammonium | 36.102 | -21.70 | 8.42 | imidacloprid | 82.41 | 0.64 | 3.76 |
4 | atrazine | 16.056 | -5.20 | 3.75 | glyphosate-isopropyl ammonium | 80.05 | -22.89 | 3.66 |
5 | 2,4-D dimethyl amine salt | 10.392 | -15.74 | 2.42 | atrazine | 59.88 | -5.78 | 2.73 |
6 | chlorpyrifos | 9.222 | 22.21 | 2.15 | chlorpyrifos | 47 | 24.77 | 2.15 |
7 | p-dichlorobenzene | 7.966 | 16.68 | 1.86 | acephate | 39.19 | 98.43 | 1.79 |
8 | 2,4-D | 7.373 | -30.75 | 1.72 | tebuconazole | 31.1 | 0.81 | 1.42 |
9 | rich-d-transallethrin | 7.357 | 48.12 | 1.72 | methomyl | 30.93 | -0.96 | 1.41 |
10 | acephate | 6.692 | 74.68 | 1.56 | clethodim | 25.81 | -27.56 | 1.18 |
These statistics was released during an industrial conference in Hefei by Mr. Zhang Wenjun, Division Director of International Exchange and Service from ICAMA. As one of the competent authorities of import/export management of pesticide in China, ICAMA issued 103,299 clearance notifications during FY2013 and about 85% of these pesticides were successfully released by customs. Mr. Zhang explained that exported or imported pesticides were randomly inspected by customs and that the sampling rate had increased from 3% to 5%. Customs has also established the detection rate as an important performance index within its internal governance system, which means that the authority is to focuse on finding any flaws in imported or exported pesticides. Compared with technical materials, formulated products will face tougher supervision. The latest pesticide Inventory under Import/Export Management was issued under announcement 1880 in 2012, which replaced the inventory issued in 2011. Mr. Zhang revealed that future updates will be made in the form of releasing amending lists instead of new inventories.
Exported pesticides need to undergo pesticide registration in destination countries and many of these countries require a certificate issued by ICAMA (ICAMA Certificate), thus ICAMA get plenty of information about the product and the registration status in the destination countries.
Top 10 Registration Countries of China exported Pesticide | |||
No | 2011 | 2012 | 2013 |
1 | Pakistan | Pakistan | Saudi Arabia |
2 | Costa Rica | Bolivia | Bolivia |
3 | Saudi Arabia | Saudi Arabia | Pakistan |
4 | Bolivia | Vietnam | Dominican |
5 | Dominican | Nigeria | Iran |
6 | Nigeria | Dominican | Vietnam |
7 | Vietnam | Egypt | Egypt |
8 | Paraguay | Kenya | Nigeria |
9 | Egypt | Turkey | Jordan |
10 | Iran | Jordan | Kenya |
Top 10 China Exported Pesticide Products Registered in Oversea Market | |||
No | 2011 | 2012 | 2013 |
1 | Glyphosate-isopropyl Ammonium AS 41% | Glyphosate-isopropyl Ammonium AS 41% | Glyphosate-isopropyl Ammonium AS 41% |
2 | Glyphosate TC | Paraquat AS 200g/L | Imidacloprid TC |
3 | Imidacloprid TC | Glyphosate TC | Glyphosate TC |
4 | Paraquat AS 200g/L | Imidacloprid TC | Azoxystrobin TC |
5 | Abamectin TC | Aluminium Phosphide DT/TB 56% | Paraquat AS 200g/L |
6 | Abamectin EC 1.8% | Abamectin EC 1.8% | Mancozeb WP 80% |
7 | Mancozeb 80% WP | Mancozeb WP 80% | Emamectin Benzoate WG 5.7% |
8 | Emamectin Benzoate TC | Lambda-cyhalothrin EC 50g/L | Carbendazim TC |
9 | Atrazine TC | Carbendazim TC | Abamectin EC 1.8% |
10 | Chlorpyrifos TC | emamectin benzoate TC | Diazinon TC |
In FY 2013, China pesticide exports rose by 8.4 % to some 8.523 billion USD and the imports rose by 23.78% to some 698 million USD.
Year | Import/Export | Product Type | Volume(000 tons) | Change (%) | Percentage of Total Trade (%) | Value(million USD) | Change (%) | Percentage of Total Trade (%) |
2012 | export | technical material | 742.62 | 13.55 | 46.43 | 5,120.82 | 30.66 | 65.12 |
2012 | export | Formulated product | 856.82 | 13.52 | 53.57 | 2,742.44 | 20.30 | 34.88 |
2012 | import | technical material | 6.36 | -7.67 | 11.89 | 105.79 | -4.95 | 18.76 |
2012 | import | Formulated product | 47.12 | 27.27 | 8.11 | 458.18 | 11.81 | 81.24 |
2013 | export | technical material | 629.20 | -15.26 | 38.8 | 5,082 | -0.75 | 59.63 |
2013 | export | Formulated product | 992.60 | 15.86 | 61.2 | 3,441 | 25.47 | 40.37 |
2013 | import | technical material | 6.20 | -2.52 | 9.98 | 99 | 93.58 | 14.21 |
2013 | import | Formulated product | 55.9 | 18.81 | 90.2 | 598 | 30.62 | 85.79 |
Herbicide was the most exported product category and some 1097.2 tons or 5,046 million USD of the product was exported in 2013, followed by insecticide, fungicide, PGRs and rodenticide. 414 Active ingredients were exported to other countries and 12 active ingredients reached over 100 billion USD in exports namely: glyphosate, paraquat, imidacloprid, atrazine, acephate, chlorpyrifos, methomyl, fipronil, corbendazim, 2,4-D, lambda-cyhalothrin and tebuconazole.
Export Volume and Value of the Three Major Product Categories in 2013 | ||||
Product Category | Volume(000 tons) | Percentage of the Total Volume (%) | Value(million USD) | Percentage of the Total Value (%) |
Herbicide | 1097.2 | 67.65 | 5,046 | 59.21 |
Insecticide | 366.8 | 22.62 | 2,355 | 27.64 |
Fungicide | 133.3 | 8.22 | 970 | 11.39 |
Volume and Value of the Top 12 Exported Active Ingredient | ||||||
No. | Active Ingredient | Volume(000 tons) | Percentage of the Total Volume (%) | Value(million USD) | Percentage of the Total Value (%) | Product Category |
1 | glyphosate | 601.97 | 37.11 | 2,367.03 | 27.77 | herbicide |
2 | paraquat | 162.014 | 9.99 | 449.25 | 5.27 | herbicide |
3 | imidacloprid | 24.141 | 1.49 | 377.57 | 4.43 | insecticide |
4 | atrazine | 50.933 | 3.14 | 195.48 | 2.29 | herbicide |
5 | acephate | 30.717 | 1.89 | 158.36 | 1.86 | insecticide |
6 | chlorpyrifos | 30.424 | 1.858 | 157 | 1.84 | insecticide |
7 | methomyl | 15.492 | 0.96 | 155.99 | 1.83 | insecticide |
8 | fipronil | 2.864 | 0.18 | 123 | 1.44 | insecticide |
9 | carbendazim | 26.304 | 1.62 | 113.69 | 1.33 | fungicide |
10 | 2,4-D | 36.525 | 2.25 | 108.39 | 1.27 | herbicide |
11 | lambda-cyhalothrin | 14.742 | 0.91 | 105.18 | 1.23 | insecticide |
12 | tebuconazole | 10.744 | 0.66 | 105.05 | 1.23 | fungicide |
| Total | 1006.87 | 62.07 | 4,415.99 | 51.81 |
|
China exported pesticides to 170 countries/regions and 21 of these destination countries sourced over 100 million USD of pesticide from China. Asia and Latin America each sourced 575,500 tons or 2,644 million USD and 405,600 tons or 2,334 million USD of pesticide from China respectively. Pesticide exports to these two areas accounted for 60.51% of total export volume and 58.41% of total export value
Volume and Value of the Pesticide to the Destination Regions in 2013 | ||||||
Rank | Country | Volume(000 tons) | Change (%) | Value(million USD) | Change (%) | Area |
1 | United State | 157.474 | 0.10 | 1,203.63 | 6.84 | North America |
2 | Brazil | 146.662 | 39.38 | 965.69 | 38.13 | Latin America |
3 | Argentina | 86 | -20.70 | 482.17 | -8.69 | Latin America |
4 | Thailand | 122.384 | 2.55 | 371.96 | 16.02 | Asia |
5 | Australia | 69.97 | -18.36 | 368.91 | -4.75 | Australasia |
6 | Indonesia | 76.793 | 12.83 | 319.91 | 23.09 | Asia |
7 | Vietnam | 80.04 | 2.05 | 318.85 | 18.39 | Asia |
8 | India | 35.942 | 4.83 | 296.26 | 8.75 | Asia |
9 | Israel | 26.49 | -20.72 | 236.53 | -20.60 | Asia |
10 | Nigeria | 77.423 | 5.06 | 206.71 | 18.32 | Africa |
11 | Russia | 33.511 | 28.26 | 179.02 | 21.34 | Europe |
12 | Colombia | 28.818 | 14.62 | 177.63 | 31.54 | Latin America |
13 | Pakistan | 30.298 | 29.83 | 172.31 | 19.03 | Asia |
14 | South Africa | 29.666 | 2.76 | 162.38 | 8.29 | Africa |
15 | Malaysia | 42.912 | 9.06 | 155.21 | 17.04 | Asia |
16 | Ukraine | 25.726 | -26.88 | 116.47 | -20.15 | Europe |
17 | Japan | 27.209 | -15.87 | 115.32 | -10.95 | Asia |
18 | Uruguay | 19.19 | 7.65 | 115.25 | 38.02 | Latin America |
19 | Ghana | 42.975 | -18.71 | 113.45 | 0.15 | Africa |
20 | Paraguay | 14.592 | -20.81 | 112.75 | -11.65 | Latin America |
21 | Turkey | 18.934 | -9.58 | 102.7 | -2.71 | Asia |
Total/Average Change | 1,193.009 | 0.35 | 6,293.21 | 8.83 |
| |
About half of the imports were fungicide and 14 active ingredients have reached over 10 million USD in imports.
Import Volume and Value of the Three Major Product Categories | ||||
Product Category | Volume(000 tons) | Percentage of the Total Volume (%) | Value(million USD) | Percentage of the Total Value (%) |
Fungicide | 23 | 37.02 | 335 | 47.99 |
Insecticide | 15.5 | 25.01 | 183 | 26.24 |
Herbicide | 23 | 27.13 | 163 | 23.44 |
Volume and Value of the Top 14 imported Active Ingredient | ||||||
No. | Active Ingredient | Volume(tons) | Percentage of the Total Volume (%) | Value(million USD) | Percentage of the Total Value (%) | Product Category |
1 | chlorantraniliprole | 588 | 0.95 | 39.3 | 5.63 | Insecticide |
2 | penoxsulam | 1,729 | 2.78 | 28.91 | 5.57 | Herbicide |
3 | tebuconazole | 87 | 1.40 | 31.34 | 4.49 | Fungicide |
4 | pyraclostrobin | 1,509 | 2.43 | 30.36 | 4.35 | Fungicide |
5 | mancozeb | 4,949 | 7.96 | 24 | 3.44 | Fungicide |
6 | thiamethoxam | 530 | 0.85 | 21.43 | 3.07 | Insecticide |
7 | metalaxyl-M | 1,295 | 2.08 | 21.13 | 3.03 | Herbicide |
8 | trifloxystrobin | 298 | 0.48 | 20.78 | 2.98 | Fungicide |
9 | fludioxonil | 681 | 1.09 | 16.99 | 2.43 | Fungicide |
10 | difenoconazole | 715 | 1.15 | 16.4 | 2.35 | Fungicide |
11 | cypermethrin | 1,644 | 2.64 | 16.07 | 2.30 | Insecticide |
12 | azoxystrobin | 554 | 0.89 | 14.48 | 2.07 | Fungicide |
13 | cyhalofop-butyl | 56 | 0.90 | 12.3 | 1.76 | Fungicide |
14 | pendimethalin | 1,646 | 2.65 | 11.77 | 1.69 | Herbicide |
| Total | 17,568 | 28.24 | 315.26 | 45.16 |
|
China imported pesticides from 37 countries/regions and 9 of these countries exported over 100 million CNY of pesticide to China. Asia and Europe respectively exported 36,300 tons or 279 million USD and 19,100 tons or 325 million USD to China. These two areas together accounted for 89.05% and 86.67% of the total imports in volume and value. Asia was not only a major destination of pesticides exported by China, but also the origin of many of the pesticides imported by China, primarily due to the fact that many MNCs have opened processing plants in Southeast Asia. These plants import technical materials from China or other developed pesticide exporting countries and resell the formulated products back to China through existing distribution channels built by the MNCs. As most of the MNCs are headquartered in Europe is another major source of imports.
Top 9 Souring Origin of Pesticide Imported by China | ||||||
Rank | Country | Volume(ton) | Change (%) | Value(million USD) | Change (%) | Area |
1 | Germany | 7,818 | 51.04 | 140.47 | 45.94 | Europe |
2 | France | 5,181 | 20.54 | 109.21 | 29.93 | Europe |
3 | India | 5,653 | -3.83 | 72.29 | 10.11 | Asia |
4 | United State | 4,253 | 11.42 | 68.98 | 27.04 | North America |
5 | Indonesia | 4,029 | 23.78 | 65.34 | 31.28 | Asia |
6 | Malaysia | 14,672 | -11.10 | 41.43 | -5.15 | Asia |
7 | Japan | 1,358 | -15.49 | 33.69 | -18.37 | Asia |
8 | Spain | 1,423 | 47.31 | 27.81 | 24.49 | Europe |
9 | United Kingdom | 657 | 57.18 | 18.61 | 100.97 | Europe |
Total/Average Change | 45,044 | 20.09 | 577.83 | 27.36 |
| |


